When I first started instrumenting an application with OpenTelemetry, I made a mistake that is easy to justify in the moment.
I assumed that more telemetry would mean better observability.
More logs meant more visibility. More spans meant better trace detail. More attributes meant stronger correlation later. At least, that was the theory.
In practice, when I eventually had to debug a real failure, the investigation did not feel faster. It felt slower. I had collected a lot of data, but I had not created much clarity.
That experience taught me a lesson I now think of as telemetry debt.
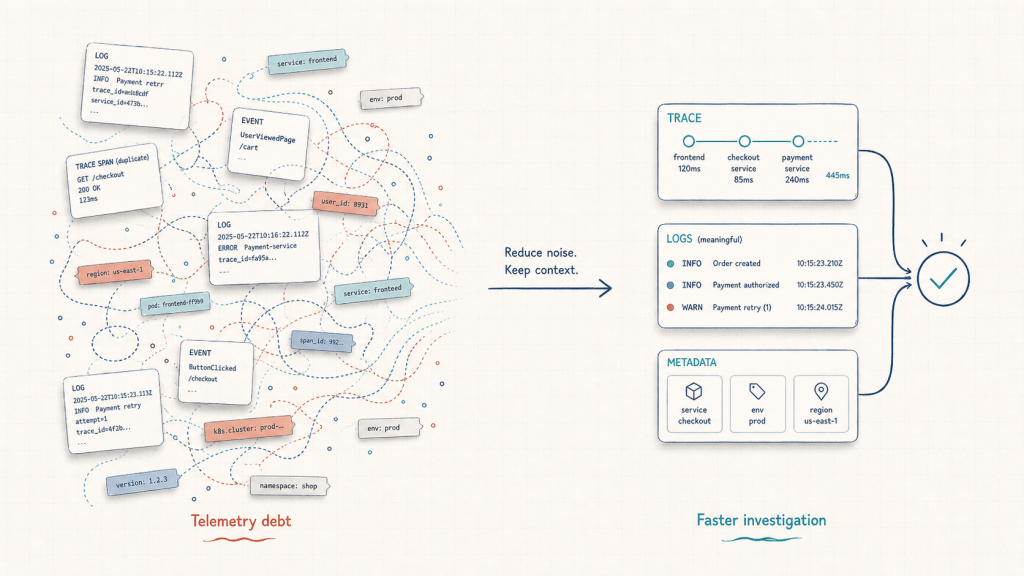
Telemetry debt is what happens when logs, traces, metrics, and metadata grow without enough structure, ownership, or intent. The system may look well-instrumented on the surface, but during an incident, engineers still struggle to answer the most important question:
What actually happened, and what should I do next?
More Telemetry Is Not Always More Observability
Observability is often discussed in terms of data collection: logs, metrics, traces, dashboards, attributes, labels, events, and integrations.
All of those are important. But collecting signals is not the same as making a system easier to understand.
In my case, I was working with OpenTelemetry instrumentation and started with the mindset that every useful detail deserved to be captured. If a function started, I logged it. If a function ended, I logged it. If a state changed, I logged it. If there was a step in the application flow, I added a span for it.
At first, this felt responsible. The traces looked rich. The logs looked detailed. The metadata looked thorough.
But when I needed to investigate a failure, that richness became noise.
The real problem was not missing telemetry. The problem was that the telemetry had not been designed around investigation.
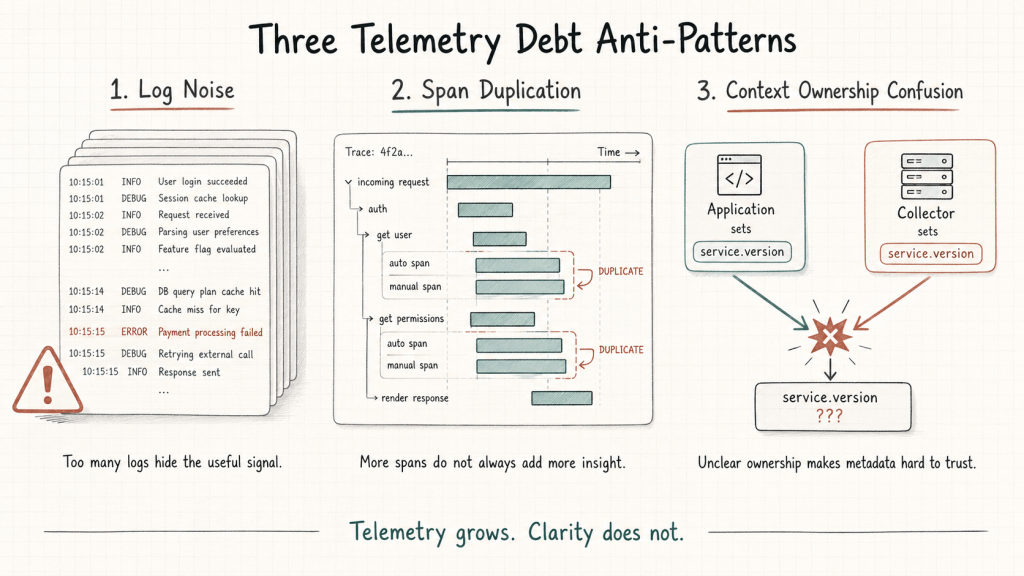
Anti-Pattern 1: Log Noise
The first mistake was excessive logging.
I added logs for function entry and exit, state transitions, and internal checkpoints. The logic seemed reasonable: if something failed, I would have enough logs to reconstruct what happened.
But in practice, logging everything created a flood of operational noise.
The line that actually explained the failure was buried among hundreds of other log lines that said very little. The system was technically producing more information, but I was spending more time filtering, searching, and deciding what mattered.
That is the first form of telemetry debt: volume without prioritization.
A useful log should help explain state, failure, user impact, or decision points. If a log only proves that code moved from one line to another, it may not help during an incident.
The question should not be:
Can I log this?
It should be:
Will this log help someone understand or resolve a failure?
Anti-Pattern 2: Manual Span Duplication
The second mistake was adding manual spans without fully accounting for what auto-instrumentation was already capturing.
OpenTelemetry makes it possible to collect traces through both automatic and manual instrumentation. Auto-instrumentation can capture common operations such as HTTP calls, database requests, and framework-level activity. Manual instrumentation is useful when you need to capture business-specific or application-specific context.
The issue appears when both approaches capture the same operation.
In my case, some operations were already being captured automatically, but I also added manual spans around them. At first glance, the traces looked rich because there were many spans. But after reviewing them closely, I realized that many of those spans were redundant.
They made the trace longer, but not more useful.
This is the second form of telemetry debt: granularity without purpose.
A trace should help someone understand the path of a request, the important boundaries it crossed, and where time or failure occurred. More spans are not automatically better if they repeat the same information.
Manual spans are most valuable when they add context that auto-instrumentation cannot know, such as:
- a meaningful business operation
- a decision branch in the application
- a workflow step
- a domain-specific status
- an important dependency boundary
If a manual span simply duplicates an existing automatically generated span, it adds cognitive load without improving understanding.
Anti-Pattern 3: Context Ownership Confusion
The third mistake was unclear ownership of telemetry metadata.
I had both the application code and the collector setting similar attributes, such as service version. That created a subtle but important problem: I no longer had a clear source of truth.
When the same metadata can be set in multiple places, engineers may not know which value to trust. Was the service version coming from the application runtime? Was it added by the collector? Was it stale? Was it overwritten? Did it reflect the deployed artifact or the telemetry pipeline?
This is the third form of telemetry debt: metadata without ownership.
Context is one of the most valuable parts of observability. Attributes such as service name, environment, version, region, pod, namespace, node, deployment ID, and image tag can make investigation much faster.
But only if they are consistent and trustworthy.
For telemetry metadata, it helps to define clear ownership boundaries:
- Application-owned context: service name, service version, business operation, user flow
- Runtime or platform context: pod name, namespace, node, cluster, container image
- Deployment context: build ID, release version, pipeline run, deployment timestamp
- Collector-enriched context: infrastructure metadata, environment tags, normalization rules
The exact ownership model may vary by organization, but the important point is this:
If everyone can set the same context, no one fully owns it.
What Changed After Cleanup
After seeing how difficult the investigation became, I stepped back and cleaned up the instrumentation.
I reduced unnecessary logs. I removed redundant manual spans. I clarified which layer should own which attributes. Instead of trying to capture everything “just in case,” I focused on the signals that would help explain system behavior during a real failure.
The result was not more telemetry. It was better telemetry.
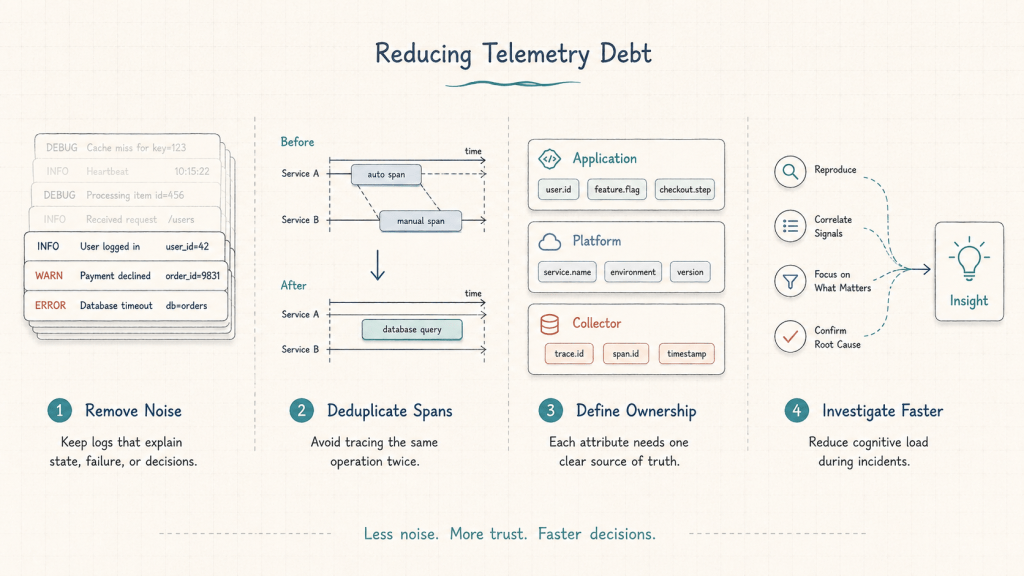
Instead of hundreds of log lines and overly dense traces, I had a smaller set of signals that were easier to reason through. The investigation path became clearer because the data had less duplication, less noise, and more intentional structure.
That reduced cognitive load.
This is the core lesson: observability should not be measured by how much data a system emits. It should be measured by how quickly that data helps a team reach the right decision.
A Better Way to Think About Instrumentation
The practical shift is to design telemetry around questions, not around availability of data.
Before adding a log, span, or attribute, ask:
- What question will this help answer?
- Who will use this during an incident?
- Is this already captured somewhere else?
- Does this signal explain state, latency, failure, or impact?
- Is the ownership of this metadata clear?
- Will this reduce investigation time or increase noise?
These questions help prevent telemetry from becoming a passive data collection exercise.
Observability should support decision-making. During an incident, engineers do not need every possible detail at equal priority. They need the right context, in the right place, with enough trust to act on it.
The Main Lesson
OpenTelemetry gave me the flexibility to instrument the system deeply. The mistake was assuming that depth alone would create clarity.
More telemetry can help, but only when it is intentional. Without structure, it can create more noise, more duplication, and more uncertainty.
That is telemetry debt.
And like other forms of technical debt, it may not be obvious when you first create it. It becomes visible later, when the system is under pressure and someone needs to understand what happened quickly.
The goal is not to collect less data by default. The goal is to collect meaningful data with a clear purpose.
Observability is not about having more signals.
It is about reaching the right decision faster.

Leave a comment